THE CHAIN JOURNAL
Independent Crypto Editorial

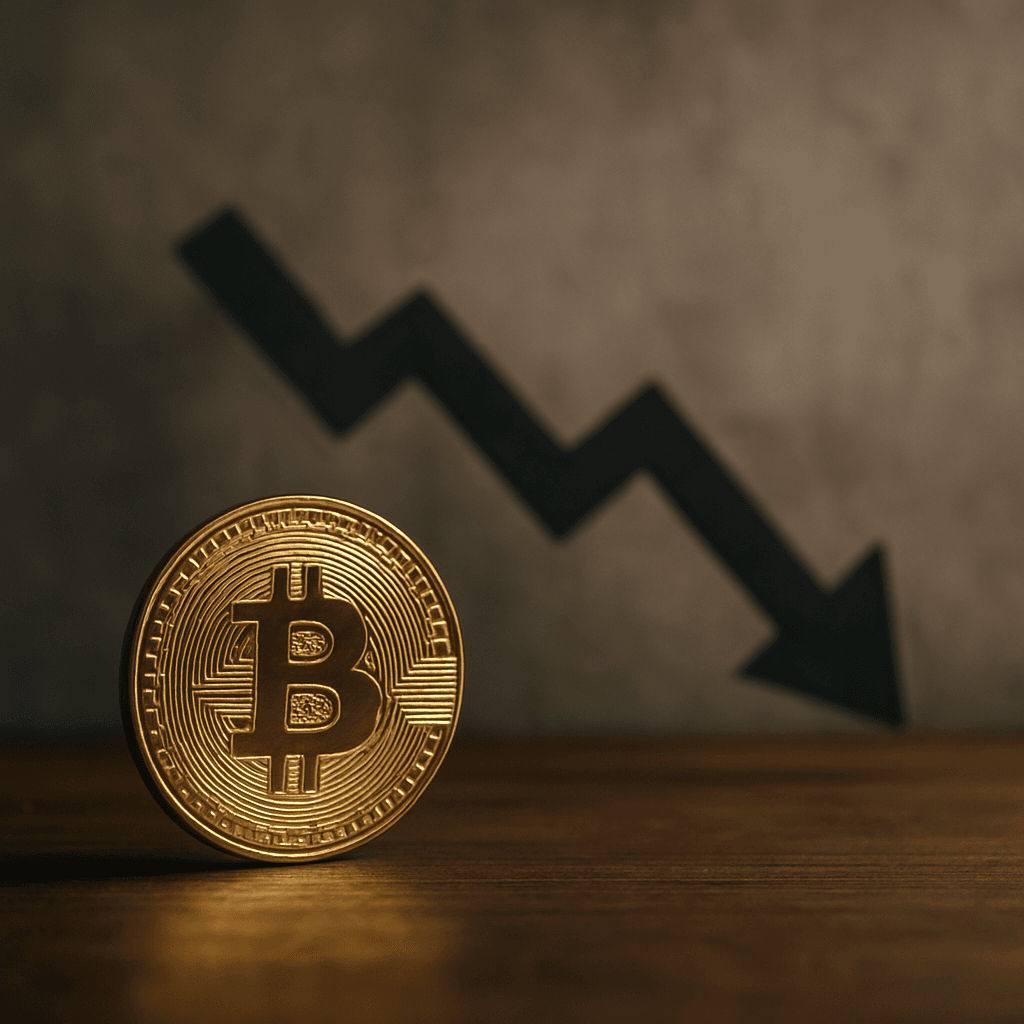
bitcoin price analysis of $107K buyers, realized losses, and bitcoin outlook 2026 as traders ask where is bitcoin headed next.
Bitcoin price analysis is shifting from simple downside watching to a more useful question: which cohort is still being forced to sell? The latest on-chain pattern suggests buyers around $107K are among those now absorbing the pain – a structure that has historically appeared near bear-market endings. That doesn’t mean a bottom is already in. It means the market may be transitioning from liquidation to digestion. In a bitcoin market update like this, the key signal isn’t price alone, but the way losses migrate from short-term hands into deeper pockets. When that transfer slows, market structure tends to improve. Until it does, the tape can still look weak even as the internal dynamics quietly begin to repair.
The broader backdrop matters here. Bitcoin has already spent months trading below several widely watched cost-basis levels – a condition that typically signals a late-stage reset rather than an early pullback. A rigorous bitcoin price analysis must therefore look beyond headline volatility and focus on realized losses, holder age, and whether sellers are still capitulating into weakness. That’s precisely where the current setup becomes interesting: the more recent buyer cohort appears to be carrying most of the stress, while longer-term supply is doing far less incremental damage than it did earlier in the selloff. In practical terms, that’s often the difference between a shallow bounce and a genuinely durable base.
Recent on-chain data shows realized losses remain elevated, but their structure increasingly resembles prior cycle lows. Long-term holder loss realization has stayed meaningful, with daily loss volumes reaching levels unseen since the last major washout. Meanwhile, Bitcoin has traded for months below its True Market Mean and short-term holder cost basis – both classic hallmarks of a stressed regime. The price zone around $69,000 now functions less like a simple chart level and more like a battleground where new buyers must prove they can absorb supply. That’s why serious bitcoin price analysis has to treat support as a process, not a line on a chart.
What makes the current setup notable is that it resembles an exhaustion phase rather than a panic phase. As tracked by on-chain analytics metrics, the data reflects a market still healing from prior speculation – not one that has fully reset. That nuance matters. A bottom can form while sentiment stays poor, but it typically requires one of two things: either forced selling dries up, or fresh demand reclaims supply faster than sellers can distribute it. Right now, Bitcoin is closer to the first condition than the second, which is why the bitcoin outlook 2026 remains constructive only if loss realization continues to fade.
The dominant market narrative still craves a dramatic all-clear signal. That’s usually too neat. In reality, major lows tend to build while most participants remain unconvinced – skeptical, sidelined, or still nursing losses. This is especially true in crypto, where reflexive selling can outlast logic by weeks. The present bitcoin price analysis points to a market that may be moving through the late stages of a bottoming process, though not yet through the finish line. If that read is correct, the next trend is less likely to arrive via a single explosive candle and more likely to emerge from a steady decline in realized losses, tighter range behavior, and a growing base of buyers willing to defend progressively higher lows.
For investors, that reframes the whole exercise. The goal shouldn’t be calling the exact bottom – it should be testing whether the market continues to absorb stress at progressively higher quality levels. A sound bitcoin price analysis would look for improving holder behavior well before expecting a decisive trend change. Historically, bear market endings announced themselves first in the data: older coins selling less aggressively, loss realization tapering off, the gap between price and cost basis slowly narrowing. Those structural cues have always meant more than whatever the short-term volatility happened to be doing.
Bitcoin price analysis suggests the market may be closer to a bottoming process than to a fresh leg lower – but confirmation still hinges on whether realized losses keep cooling. The point isn’t to chase certainty; it’s to watch for evidence that supply is changing hands more cleanly. In a bitcoin price analysis like this, the most important question is whether late buyers become forced sellers or patient holders. Those two outcomes lead to very different markets.
Two signals deserve close attention in the weeks ahead: a sustained drop in loss realization, and a firmer reclaim of key cost-basis levels. If both improve together, the case for a durable floor strengthens considerably. If they diverge or stall, the market can still grind lower for weeks even after the worst of the selling appears to be over. That’s exactly why bitcoin market update traders should stay data-led rather than narrative-led – the story the charts tell is almost always more reliable than the one making the rounds on social media.
Focus: bitcoin price analysis now points to a market that may be forming a floor, but only the next phase of loss absorption will confirm it.
Clara Reyes, Markets & Data Reporter, The Chain Journal
A weekly briefing on Bitcoin price action, Ethereum, crypto market analysis, Bitcoin ETF flows, regulation, digital assets, and the narratives shaping crypto investing.
One sharp weekly read. No daily alerts. No recycled headlines.