THE CHAIN JOURNAL
Independent Crypto Editorial


bitcoin price analysis of the $77K range, bitcoin market update on Iran risk, and bitcoin outlook as liquidations keep driving swings.
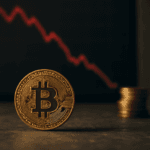
Start with the uncomfortable truth: this market belongs to derivatives traders, not spot buyers. BTC’s push toward $78,000 faded almost as quickly as it arrived, looking less like trend confirmation than a surgical sweep through crowded liquidity. The same pattern has defined recent sessions – sharp wicks, weak follow-through, and a wall of sellers that materializes the moment fast money gets flushed out. That tells you something important: the current range is being set by positioning, not conviction. For now, the $77,000 area behaves like a magnet, while $78,000 looks more like a stop-run than a genuine breakout. Any serious bitcoin price analysis must therefore treat the chart as a map of leverage, not optimism.
The broader backdrop still ties BTC tightly to macro headlines, particularly Iran-related risk and the oil complex. When geopolitical tension spikes, Bitcoin tends to behave like a high-beta risk asset first and a macro hedge second. That split personality matters. If traders expect lower oil prices, softer inflation, and eventually easier financial conditions, they bid BTC. If fresh conflict risk enters the picture, they de-risk immediately and ask questions later. This is precisely why a bitcoin price analysis that ignores geopolitics misses the mechanism driving price action. The market is never simply “bullish” or “bearish” – it is constantly repricing the probability that liquidity conditions will improve or deteriorate with the next headline.
The most immediate driver is a derivatives structure that still looks fragile. Bitcoin price analysis across recent sessions points to the same recurring dynamic: liquidity grabs around obvious levels, followed by forced unwinds when price slips beneath them. That is precisely the kind of structure that creates the illusion of strength while quietly loading fragility underneath. As tracked by liquidations derivatives metrics, the market has continued to punish crowded longs whenever BTC loses momentum – which explains why the same zone keeps drawing repeated tests. In that sense, liquidation hunts are not a sideshow. They are the price-discovery process itself.
A second layer is the institutional flow question. When BTC holds its ground even after macro shocks, the market tends to read that as passive demand absorbing supply from forced sellers. That does not guarantee immediate upside, but it does mean the downside becomes less linear. Put differently, a bitcoin price analysis should distinguish between intraday volatility and structural demand. The market can stay choppy and still be building a base – but only if buyers are stepping in after each flush rather than chasing each rebound. The critical variable is not whether BTC pops two or three percent in a given session. It is whether dips are being bought with size.
Yes – and that is the uncomfortable answer. Bitcoin price analysis has effectively become a study in how efficiently the market sweeps late longs, rather than a clean read on long-term conviction. That does not invalidate the trend; it makes it conditional. If the market keeps oscillating between peace-deal optimism and renewed geopolitical stress, BTC will likely continue trading as a fast macro proxy with leverage stacked on top. That is why the chart can look constructive one day and brittle the next. The real question is not simply direction – it is who is trapped on each move. A market dominated by forced positioning tends to overshoot in both directions, which is why rallies stall quickly and selloffs can reverse just as fast.
This is where internal structure matters far more than the headline print. A rigorous bitcoin price analysis has to ask whether the market has cleared enough leverage to allow a cleaner advance. If not, every push higher risks becoming fuel for yet another liquidation sweep. It is also why strong ETF inflows remain relevant – they can offset leverage churn, but only when they arrive consistently rather than in isolated bursts. Until that steadier bid materializes, BTC stays vulnerable to headline shocks, particularly when traders crowd into the same obvious levels at the same time.
Bitcoin price analysis points to a market still working through a digestion phase, not one on the verge of a decisive breakout. The clearest read is that BTC remains caught between macro hope and derivative pressure, with $77,000 serving as the most visible pivot. Should the Iran risk premium ease and oil prices stay contained, Bitcoin can recover with considerably less friction. But if energy prices rebound or geopolitical headlines deteriorate, the market will likely keep probing downside liquidity before any durable trend takes hold. On balance, bitcoin price analysis favors patience over prediction here.
Three things are worth watching closely: whether spot demand absorbs the next meaningful dip, whether funding rates and open interest cool further, and whether BTC can reclaim lost levels without triggering another sharp liquidation event. Those signals carry far more weight than any single intraday spike. If price keeps climbing while leverage simultaneously rebuilds, the market is not establishing a clean trend – it is loading the spring for another squeeze.
Focus: bitcoin price analysis says the market is still pricing leverage first and conviction second.
Adam McCauley, Senior Blockchain Analyst, The Chain Journal
A weekly briefing on Bitcoin price action, Ethereum, crypto market analysis, Bitcoin ETF flows, regulation, digital assets, and the narratives shaping crypto investing.
One sharp weekly read. No daily alerts. No recycled headlines.