THE CHAIN JOURNAL
Independent Crypto Editorial

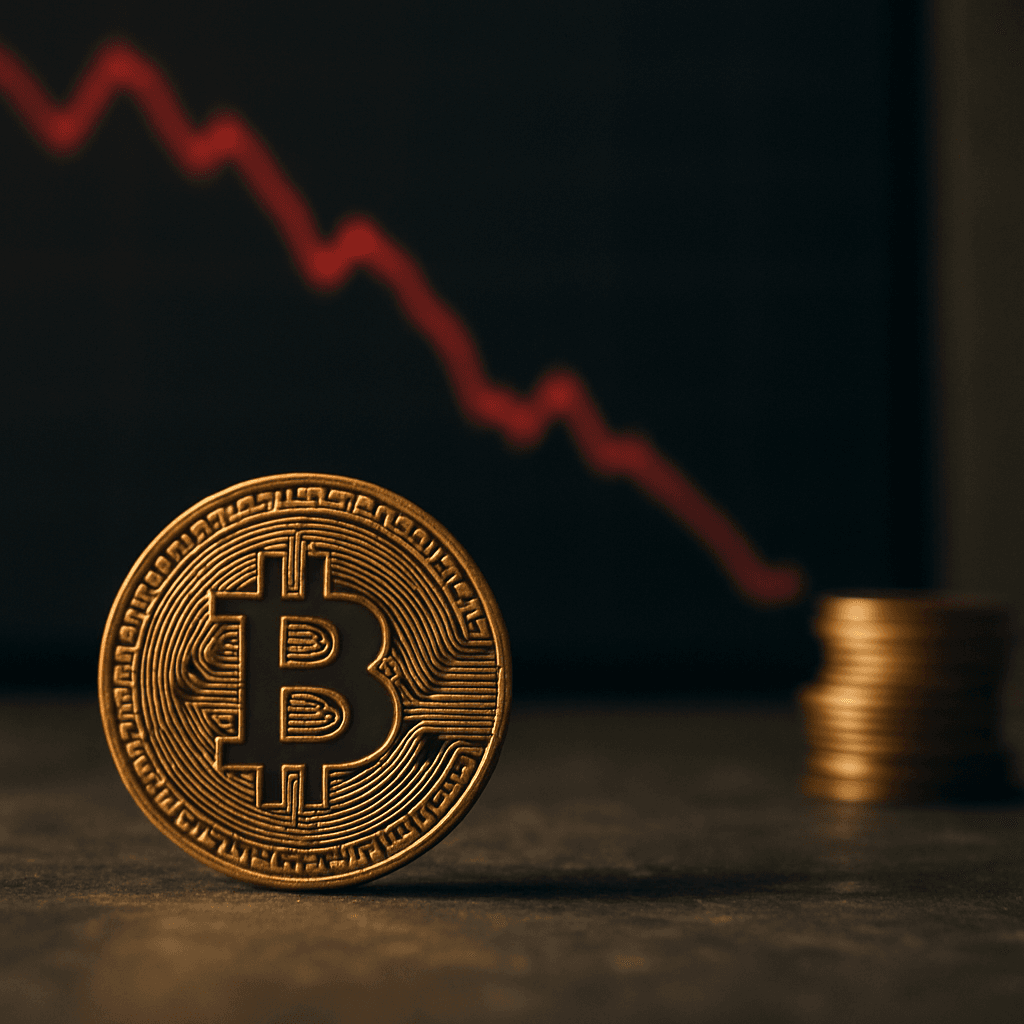
Bitcoin price analysis shows a possible bear-market floor as bitcoin market update data, bitcoin outlook and sentiment weaken.
Bitcoin price analysis now hinges on a deceptively simple question: is this just another flush, or the kind of drawdown that marks a structural low? The market has pulled back to within roughly 10% of realized price – the on-chain level that tracks the aggregate cost basis of all circulating coins. In prior cycles, that band has often sat near the dividing line between late-stage capitulation and early accumulation. A move this deep does not guarantee a bottom, but it does reveal where stress is concentrating. For traders, that matters far more than headlines. The market is no longer pricing only momentum; it is pricing balance-sheet pain, patience, and whether genuine buyers can step in before forced sellers exhaust themselves.
That is precisely why bitcoin price analysis should not be treated as a prediction exercise in isolation. The real value lies in regime detection. When price drifts toward realized price following a prolonged selloff, the market typically shifts from narrative-driven trading to something more unglamorous: inventory management. Recent on-chain data reinforces this picture, showing Bitcoin trading in a defensive zone between cost-basis layers, with short-term holders still underwater and recent buyers more inclined to defend rallies than chase them. In practical terms, any bounce can fail quickly unless demand broadens well beyond tactical dip-buying. The next decisive move will most likely be determined by whether spot buyers can absorb supply without leaning on leverage to do it.
The cleanest reading from bitcoin price analysis right now is that support matters more than upside targets. Glassnode-style cost-basis bands place the current market inside a corridor where realized price remains a meaningful lower reference, while overhead supply can still blunt every relief move. The market is not simply “down” – it is inside a valuation pocket where prior buyers are quietly deciding whether to hold, average in, or cut losses. That is a far less forgiving setup than a routine trend correction. A reclaim of the higher cost-basis bands would change the picture materially, but until that happens, price action stays vulnerable to abrupt liquidation cascades.
Context matters here too. Bitcoin ETFs have not provided the same steady, one-way bid they delivered during stronger market phases, leaving spot more exposed to shifts in risk appetite. Meanwhile, sentiment remains deeply washed out – the crypto sentiment index is still registering fear rather than complacency. That combination has historically created fertile ground for a tradable bottom, though it offers no precision on timing. What it does tell you is that the market is closer to exhaustion than euphoria – and that is exactly where serious bitcoin price analysis becomes more valuable than simple price watching.
The strongest argument for a floor has nothing to do with Bitcoin being cheap in any abstract sense. It is that selling pressure appears less efficient than it was earlier in the decline. If weak hands have already been shaken out, then further downside requires either a meaningful macro shock or a fresh wave of distribution from larger holders. That is precisely why the realized price zone carries weight: it is where late-cycle pain becomes legible in the data, and where the market discovers whether there is real sponsorship beneath the surface. I would still treat any “bottom is in” narrative as premature. History is clear that these zones can break lower before they stabilize – particularly when macro liquidity is offering no tailwind.
A more productive framing is to think in stages. First comes leverage unwinding. Then comes sentiment collapse. Then comes a quieter, harder-to-spot period in which price stops falling simply because marginal sellers run out of urgency. Bitcoin may be entering that third phase, but it has not proved it yet. The more durable the base, the more you should see spot demand improve while volatility compresses and forced liquidation activity fades. That longer arc is also central to our Bitcoin Price Outlook 2026 framework – markets can spend a surprisingly long time looking broken before they become genuinely investable again.
Bitcoin price analysis now points to a market where the reward for patience is likely to improve before the reward for aggression does. If realized price continues to act as a gravitational anchor, disciplined dip buyers may find better asymmetry than momentum traders – but only if they accept that a final washout remains possible. The market does not need a compelling bullish thesis to bounce; it needs less forced supply. That is a very different proposition, and it demands a different posture. A decisive reclaim of key cost-basis bands would improve the setup considerably, but until that confirmation arrives, this is a market for careful position sizing rather than heroic conviction.
The things worth watching closely are straightforward: spot volume, funding rates, ETF flows, and whether downside wicks start getting bought with increasing speed. If price stabilizes while leverage stays muted, bitcoin price analysis improves quickly. If funding flips positive too early against thin volume, rallies will almost certainly fade. The most meaningful confirmation will not arrive in a single candle. It will show up gradually – in evidence that sellers are losing control while buyers quietly accumulate patience.
Focus: bitcoin price analysis suggests the market is closer to exhaustion than euphoria, but a durable floor still needs proof from spot demand.
Adam McCauley, Senior Blockchain Analyst, The Chain Journal
A weekly briefing on Bitcoin price action, Ethereum, crypto market analysis, Bitcoin ETF flows, regulation, digital assets, and the narratives shaping crypto investing.
One sharp weekly read. No daily alerts. No recycled headlines.